
Taming the Jabberwock with Application Analyzer
Sometimes it can be hard or a daunting task to try to unravel a large Content Server Application (aka “CS App”: a packaged collection of WebReports and components, to fulfil a business purpose) you have been tasked with troubleshooting, maintaining, or extending.
In this blog, Steve Chan charts his journey in getting to know Ravenblack’s Application Analyzer, and how it can help you both maintain and develop new applications, in an easy-to-use, single interface.
‘Twas brillig, and the slithy toves
Did gyre and gimble in the wabe;
All mimsy were the borogoves,
And the mome raths outgrabe.
“Jabberwocky,” a poem from Through the Looking-Glass, and what Alice Found There by Lewis Carroll
Illustration by John Tenniel (1871)
Introduction
Faced with attempting to understand a large and unfamiliar application, it may seem unintelligible (non-sensical, even!) to begin with.
Armed with Ravenblack’s Application Analyzer, you can make complex and onerous tasks more manageable with built-in tree or graphical views, and ready-to-run reports, which include both audit and documentation features. The Application Analyzer can also accelerate development time, with its unified interface, advanced search, and enhanced editing features.
Application Analyzer will help you tame that unwieldy application!
Why Application Analyzer?
The Application Analyzer is a multi-function tool that provides a holistic view of Content Server with emphasis on WebReports and related objects, giving administrators and support insight into all applications on a CS instance, and accelerating development for creators through a unified interface and utility features.
I know what you’re thinking:
“I’m an experienced Content Server (CS) Administrator or WebReports developer already using standard Content Server UI (CSUI). Why should I learn a new framework to manage or develop WebReports in?”
Exactly my position not so long ago!
Here are a few examples to illustrate how Application Analyzer can help in various situations.
He took his vorpal sword in hand:
Long time the manxome foe he sought—
So rested he by the Tumtum tree,
And stood awhile in thought.
Maintenance support
We’ve all been there:
You’re a professional services consultant or CS administrator on a new client site, and they have several CS Apps that have performance issues, need troubleshooting, or they need to extend functionality to support a change in business process.
The only problem is:
You weren’t involved in the design or development of the applications in the first place, the original developers have since moved on, and there is little or no documentation, or what there is, is typically out of date. (Even if you did build one or more of the applications, you probably don’t remember how it was originally constructed!)
So, what do you do?
First, pour yourself a large, strong cup of coffee (or whatever will perk you up!), and start wading through the folders and content of each application, looking for the start point, and any markers that will help guide you through understanding the structure, and how it was put together.
So many times I have thought:
“If only there was a tool that would show a graphical representation of which WebReport calls which WebReport in the application, and could crawl through the application providing a listing of components and descriptions. That would be a great help in understanding and producing documentation about the application!”
Well, now such a tool exists:
Ravenblack’s Application Analyzer
Here’s a few choice features that will help you understand and work with any application:
Count of objects
As the name suggests, Application Analyzer helps you to analyze the content of applications. As its most basic level, it will automatically count the number and type of objects in a CS Application.
I’ve done this many times before on customer sites by manually running a LiveReport SQL query against the CS database...now it’s available out of the box in Application Analyzer!
This will give you a basic set of metrics to quickly gauge the size and complexity of the CS App you’re dealing with:
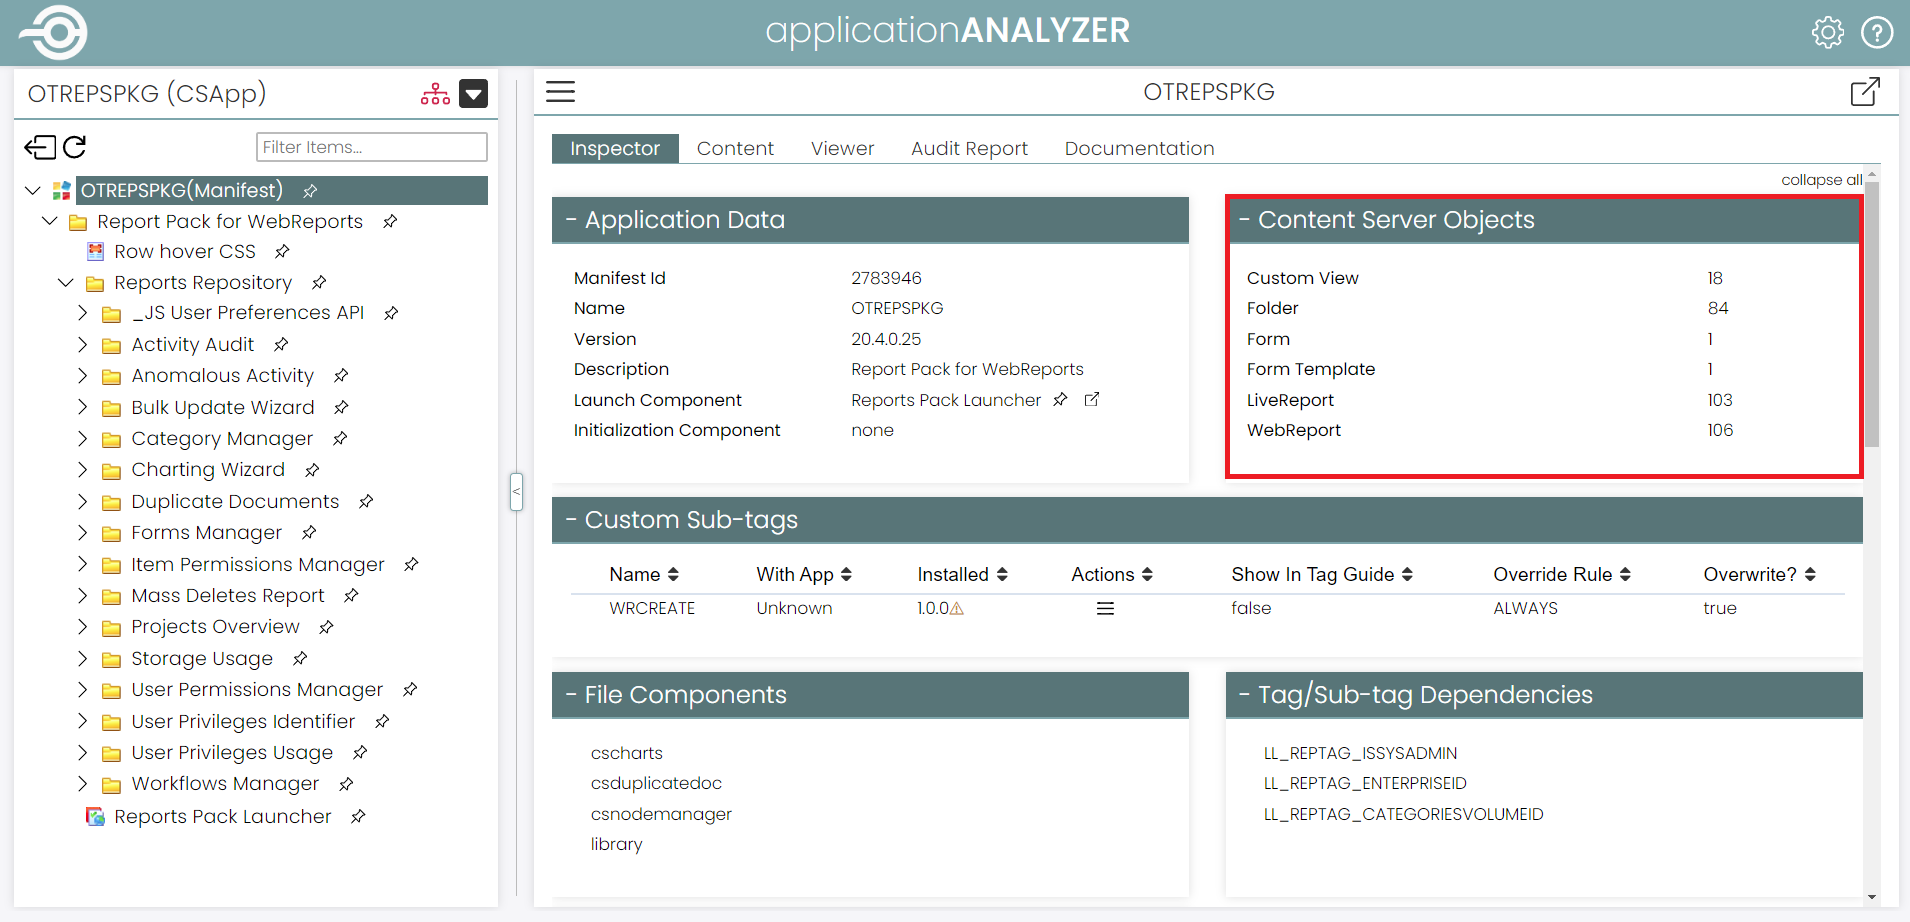
On this page you can see other sections that automatically identify: Custom Sub-tags, File Components, Tag/Sub-tag Dependencies, Version Changes since installed with “diff” functionality (not shown above) etc., all without having to make a separate visit to the CS Applications Management page.
Graphical view of hierarchy
While the screenshot of Application Analyzer above shows a nested tree view of an application in the left-hand frame, you can easily switch to a graphical view by clicking on the icon (![]() ). This shows the call hierarchy of the application and lets you drill down to see dependent objects and how it has been constructed.
). This shows the call hierarchy of the application and lets you drill down to see dependent objects and how it has been constructed.
In the past I’ve manually drawn up such diagrams using Visio to facilitate documentation and hand over to support: now this can be automatically done using Application Analyzer!
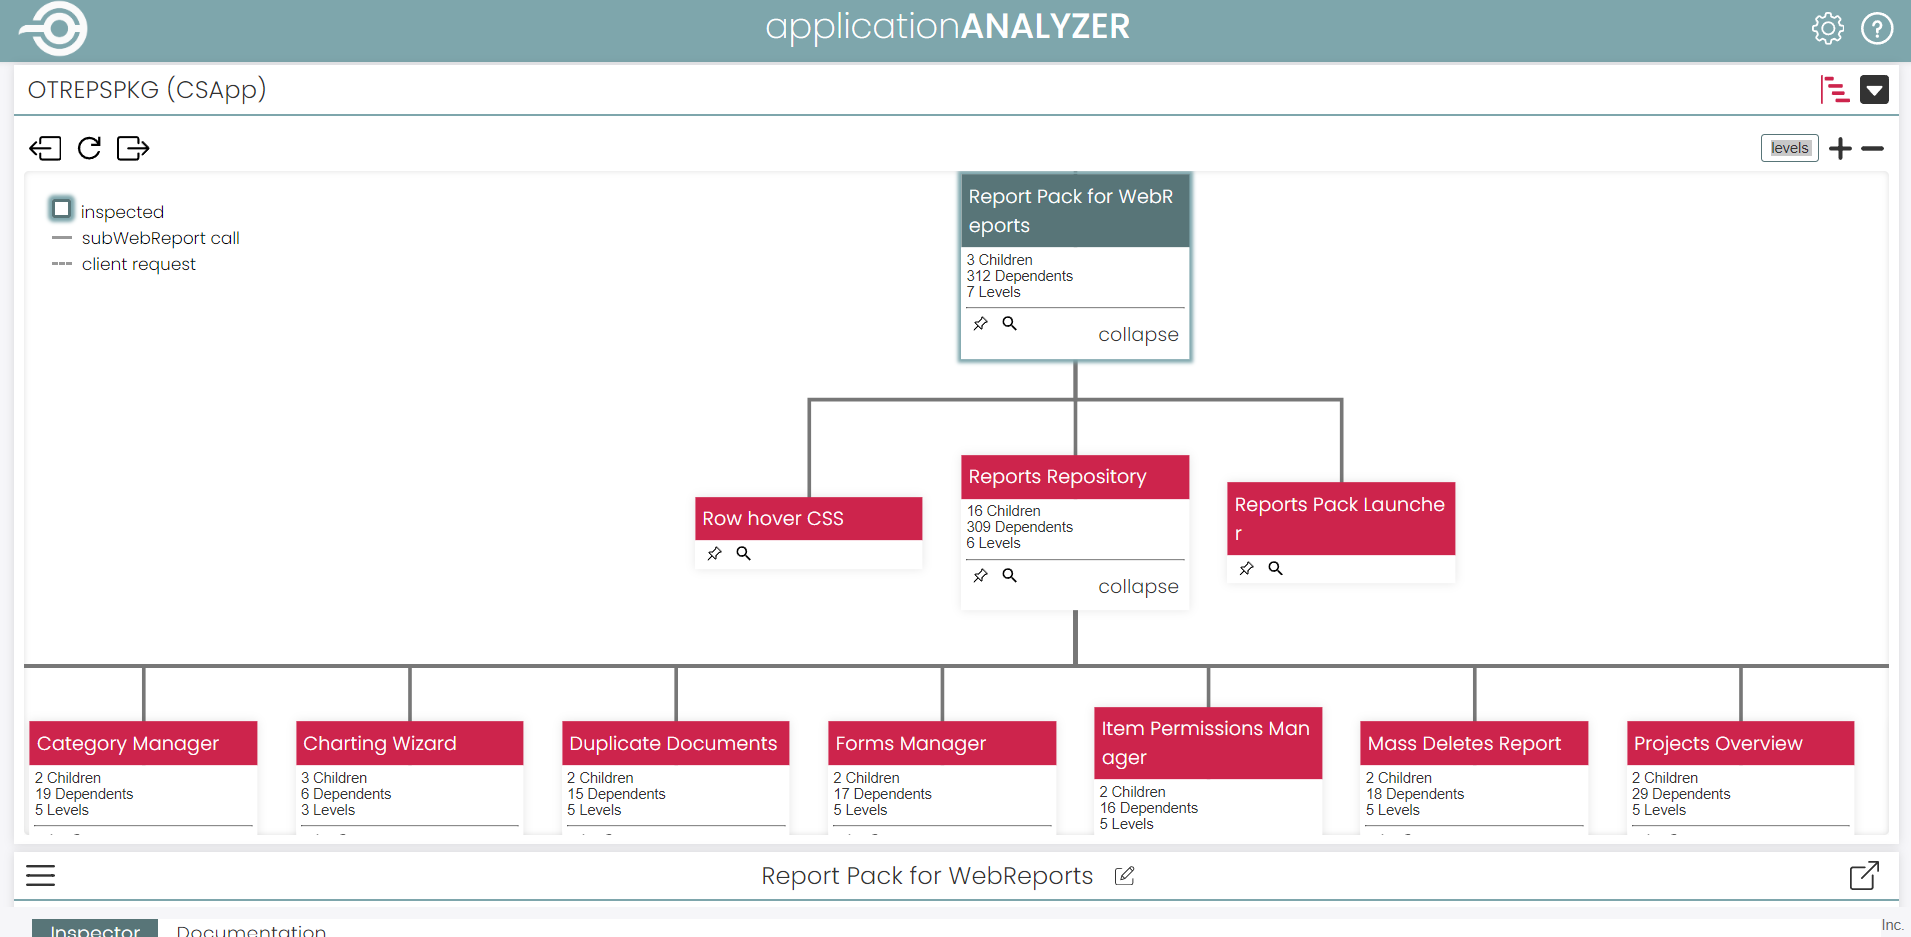
Using the tree or graphical view of the application, you can quickly inspect each component for view or editing by clicking the thumbtack icon (![]() ) to load it:
) to load it:
Inspection panel
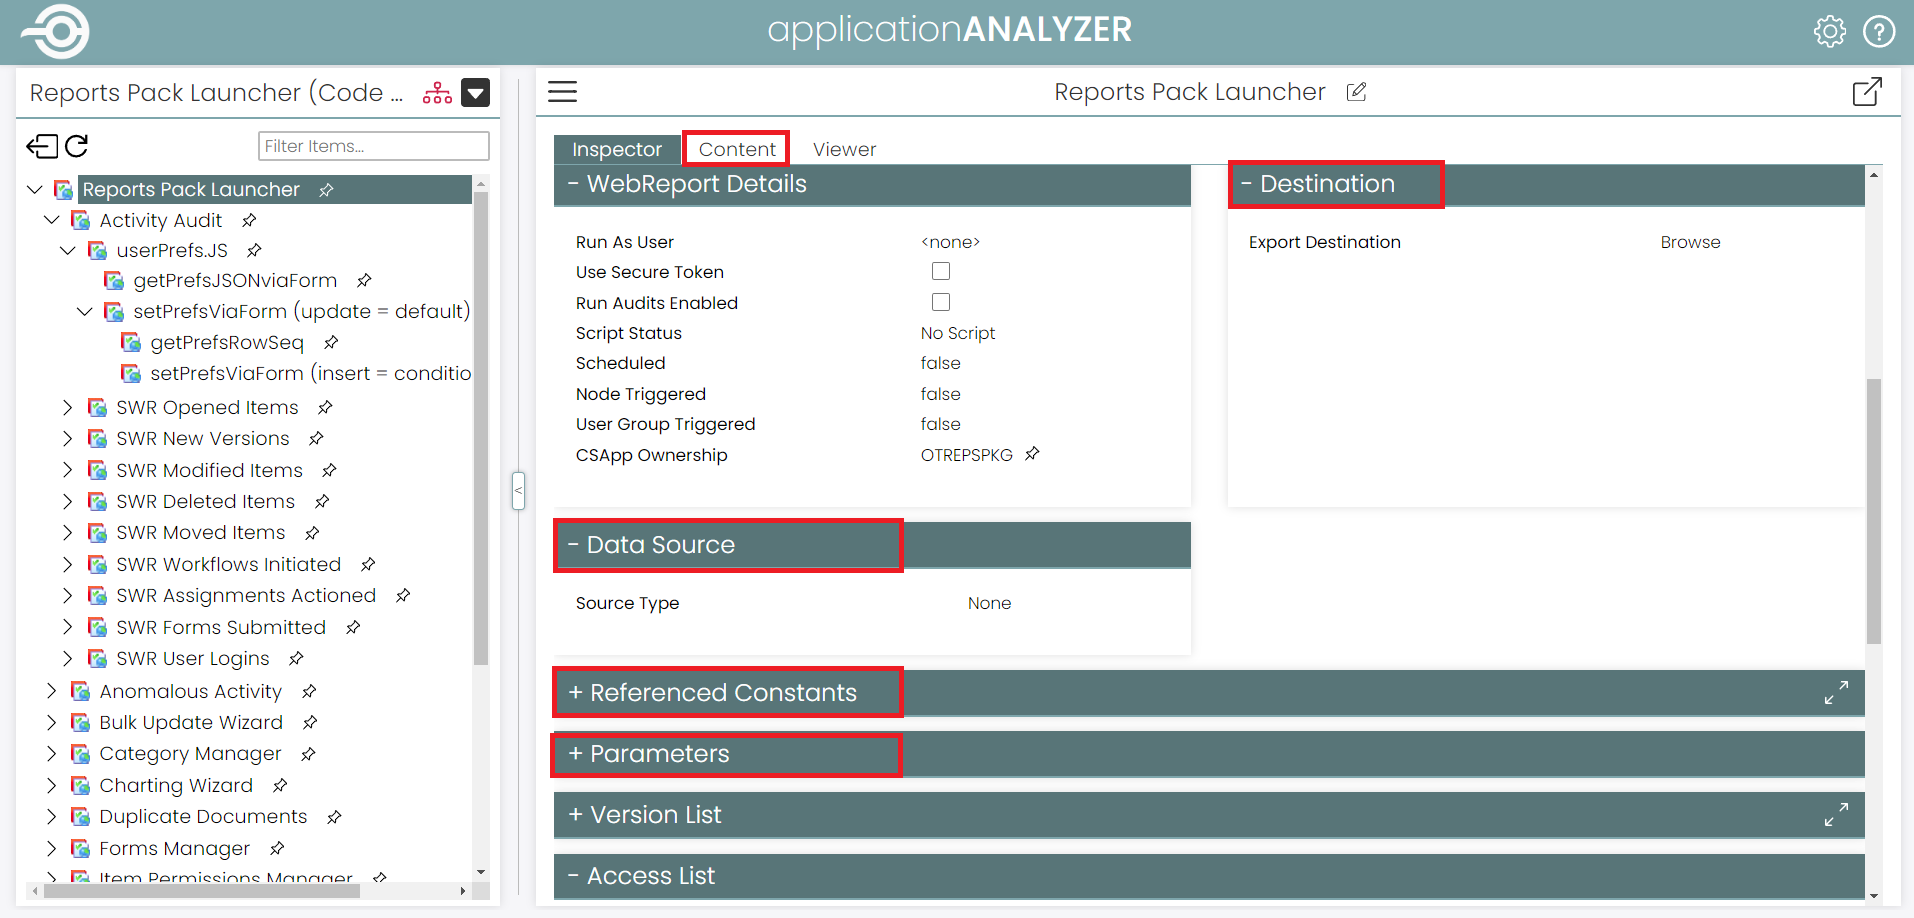
For a WebReport, you can see that all the relevant information is gathered in a single interface: Source, Destination, Constants, Parameters. No more clicking around multiple tabs as in the standard CS User Interface! And the ability to edit the Reportview directly via the Content tab.
Read more about the features available from the Inspection panel later, including the ability to easily find which WebReports call the current WebReport you are looking at.
Note that the sections displayed in the Inspection panel are relevant to the object type being viewed, eg. Workflow Maps will display Workflow Instances, Form Templates will display Form Views, Business Workspaces will display related parent/child Workspaces, etc.
Audit reports
Now you’ve got an idea as to the scale of the application you’re dealing with, and using the tree/graphical views, a good idea as to what it is and how it’s been put together.
How about a quick sanity-check audit about its validity and performance?
Application Analyzer has two types of Audit Report, one for WebReports and one for LiveReports.
While not a substitute for a formal review by an experienced CS consultant or developer, think of it as the equivalent of a basic “MOT” or “Vehicle Inspection” for a CS application, to automatically highlight areas for consideration.
WebReport Reference Audit

This WebReport Audit will look for issues such as literal DataIDs used in WebReports (object references should be used for better transportability), undefined Constant values, as well as recommendations for syntax improvements.
LiveReport Feature Audit

This LiveReport Audit will look for potential issues categorized under Performance, Database Blocking, and Bug Prevention.
Auto-generated documentation
Sometimes considered the bane of software development, keeping documentation relevant and up to date can be a time-consuming process.
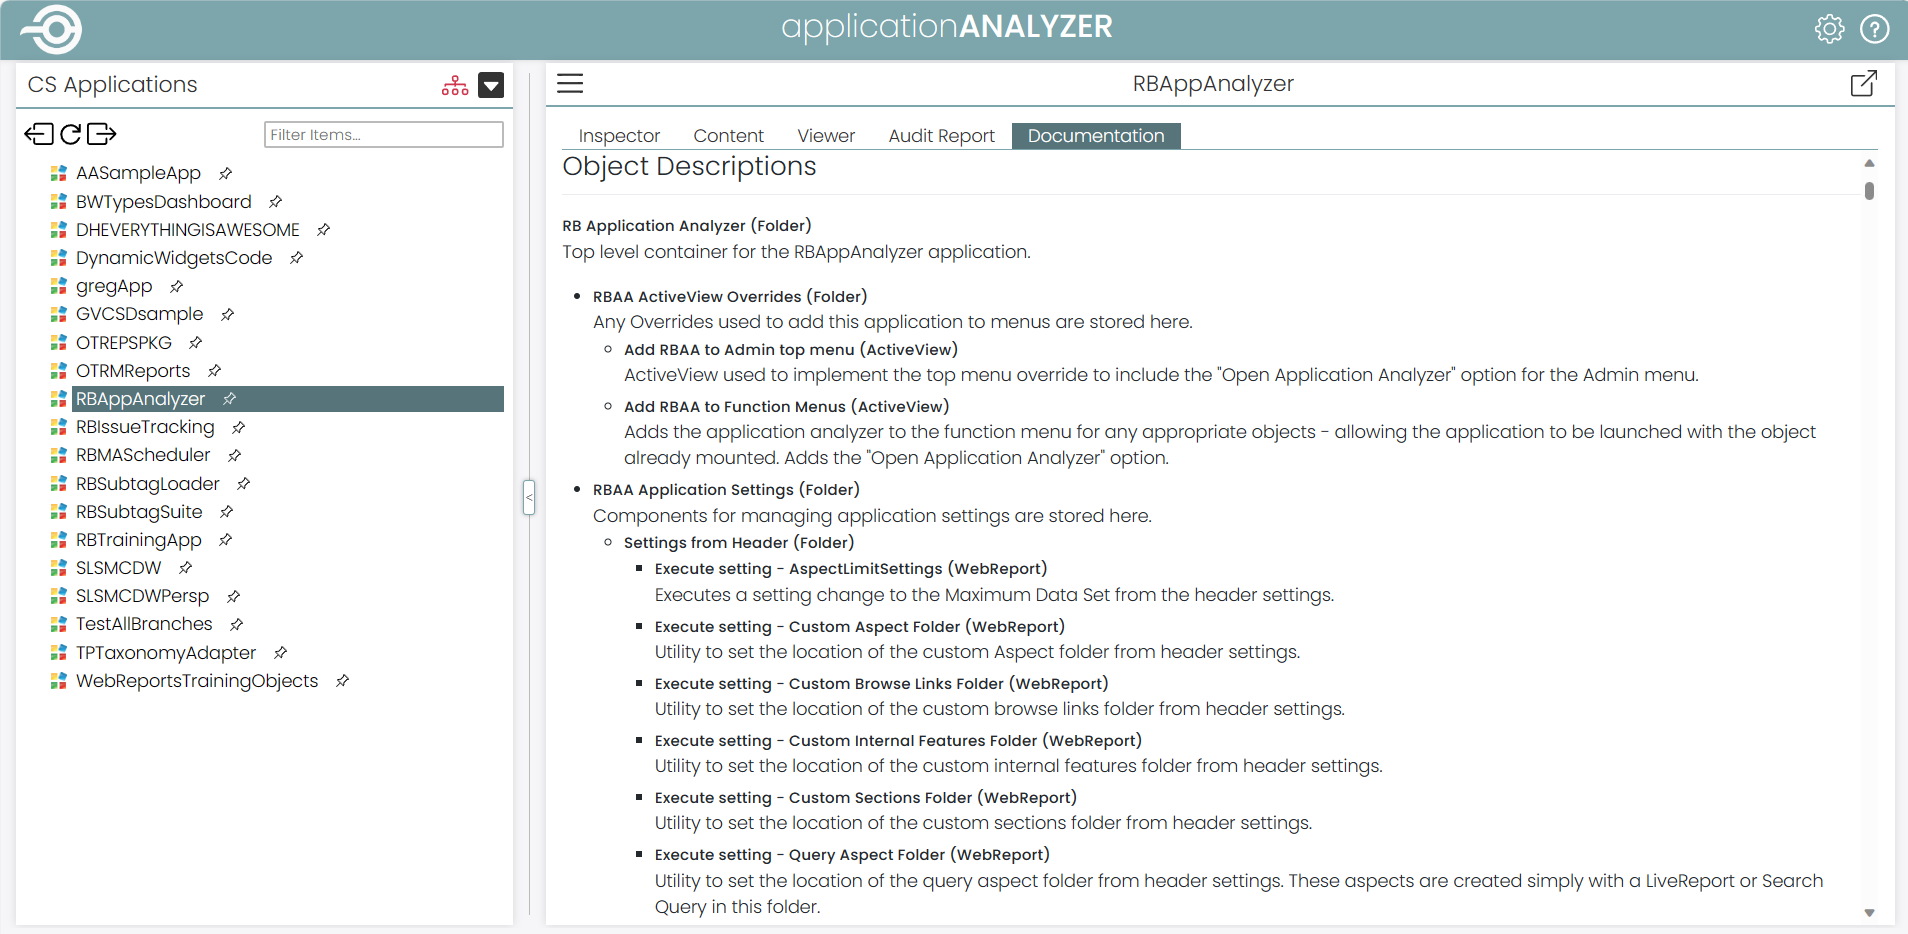
Not so with Application Analyzer! If you have been diligent enough to populate the Description field of objects in your application, Application Analyzer can crawl through the application to automatically build a documentation page based on the Name and Description of the objects in your application, automatically showing the folder or call hierarchies (or both).
No more having to maintain a separate document for the application, which gets quickly out of date!
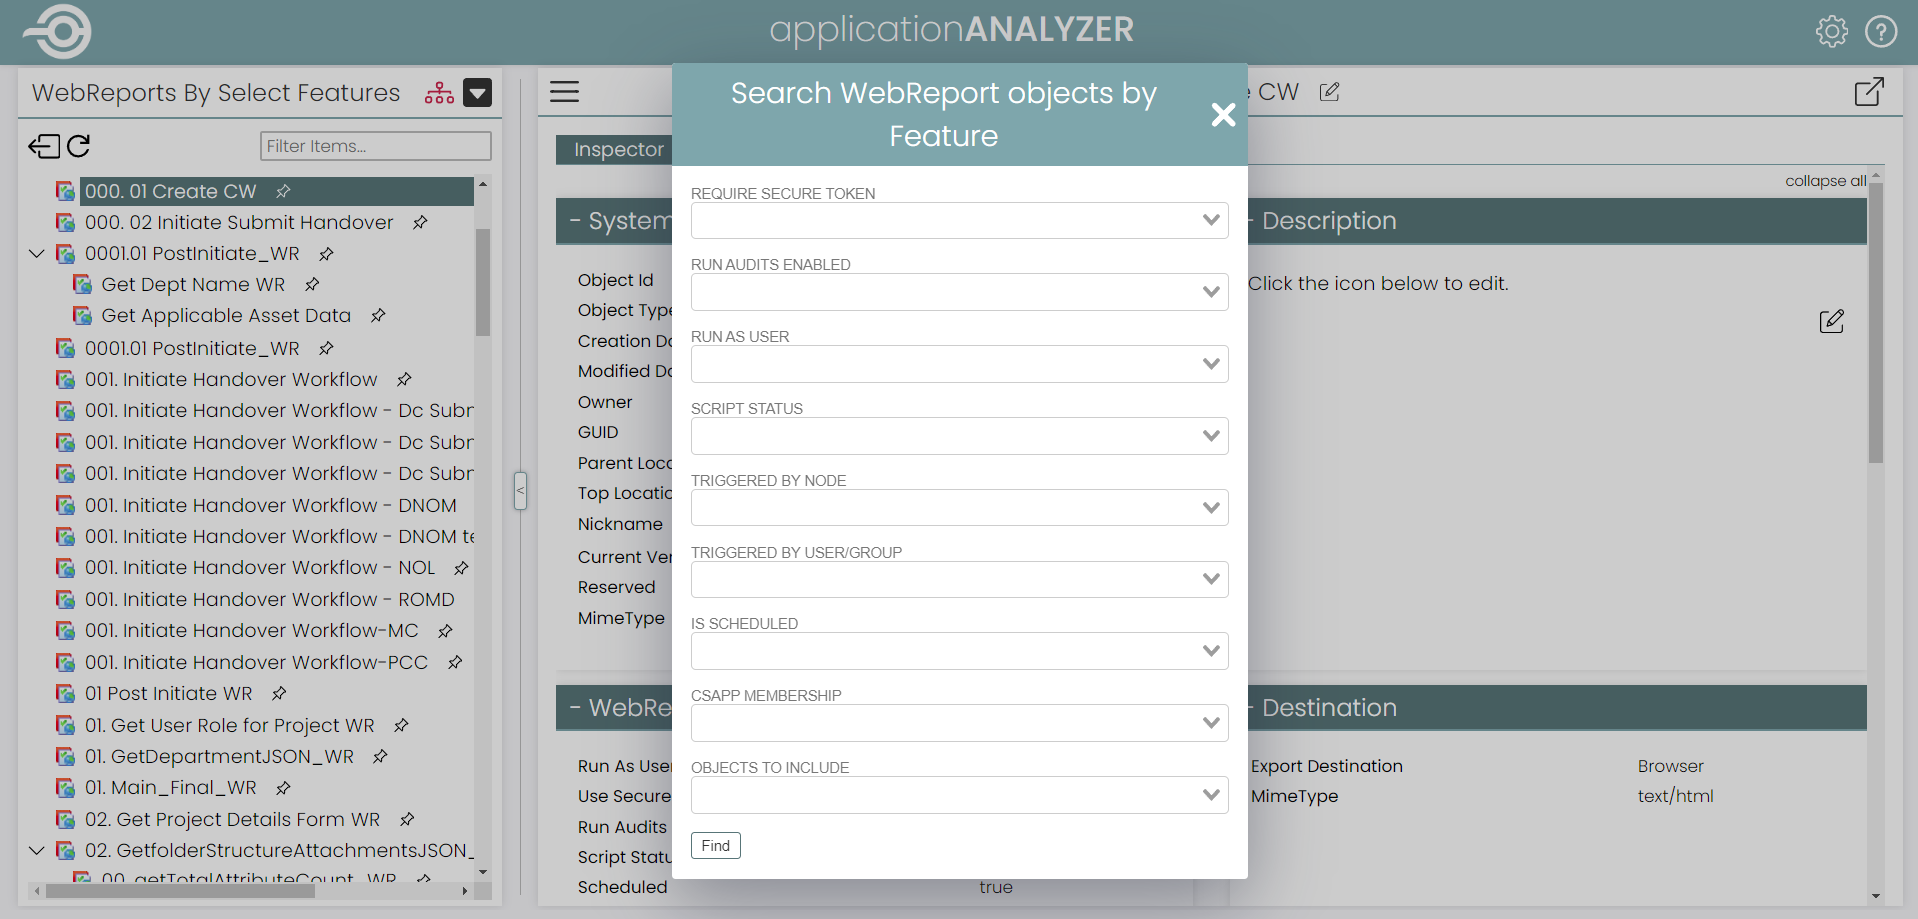
Search WebReport objects by Feature
So far, I have highlighted a few features specific to inspecting a CS application. How about if you’re looking for features across the CS Enterprise, whether they have been configured as a CS application or not?
Search WebReport objects by Feature is one of several searches that allow location of WebReports that perform a specific function, eg. those that are Scheduled WebReports, based on WebReport Triggers, or use the Run As User feature.
This is an invaluable time-saver when trying to hunt down WebReports that may be impacting performance or pose a potential security risk.
Maintenance support summary
I’ve highlighted above a few choice features of Application Analyzer that I’ve found useful in the short amount of time that I’ve had exposure to it.
If only this tool had been available to me on client sites, it would have saved a lot of time and effort from having to find or map this information out manually!
Application Analyzer is a tool that gives you the ability to review, take stock, and appreciate how an application has been put together, to be able to identify and make targeted modification changes.
One, two! One, two! And through and through
The vorpal blade went snicker-snack!
He left it dead, and with its head
He went galumphing back.
Development
So, if the maintenance-related aspects of Application Analyzer above don’t persuade you, what’s in it for the developers amongst us?
To be honest, I was a little skeptical myself at first, but by way of example, here are a few choice features that I’ve picked up and find useful after a bit of exposure to Application Analyzer.
Worked example
By way of example, I thought I’d walk you through identifying a change I have been considering to an area of functionality I had extended in a larger application, the baseline application of which was written by someone else.
The requirement was to identify the occurrences of a WebReport that read application configuration settings stored in the database, as a candidate for replacement by custom Sub-tag, for the purpose of optimizing the code.
Aspect panel: Filter by Name
Having first loaded the CS Application in the Aspect (left-hand) panel of the Application Analyzer, I recalled the WebReport that read the configuration file had “config” in the title (Name).
By simply entering “config” in the text box on the Aspect panel, Application Analyzer instantly filtered the results by Name (case insensitive), and displayed the folder hierarchy of the relevant items—I didn’t need to go manually browsing for them myself (in amongst the multitude of folders and content) or recall exactly what the WebReport was called.
In the screenshot below you can see that it identified both a WebReport and its source LiveReport, both with “config” in the name; the source LiveReport is verified by the Data Source section of the Application Analyzer’s Inspection panel (right-hand side):
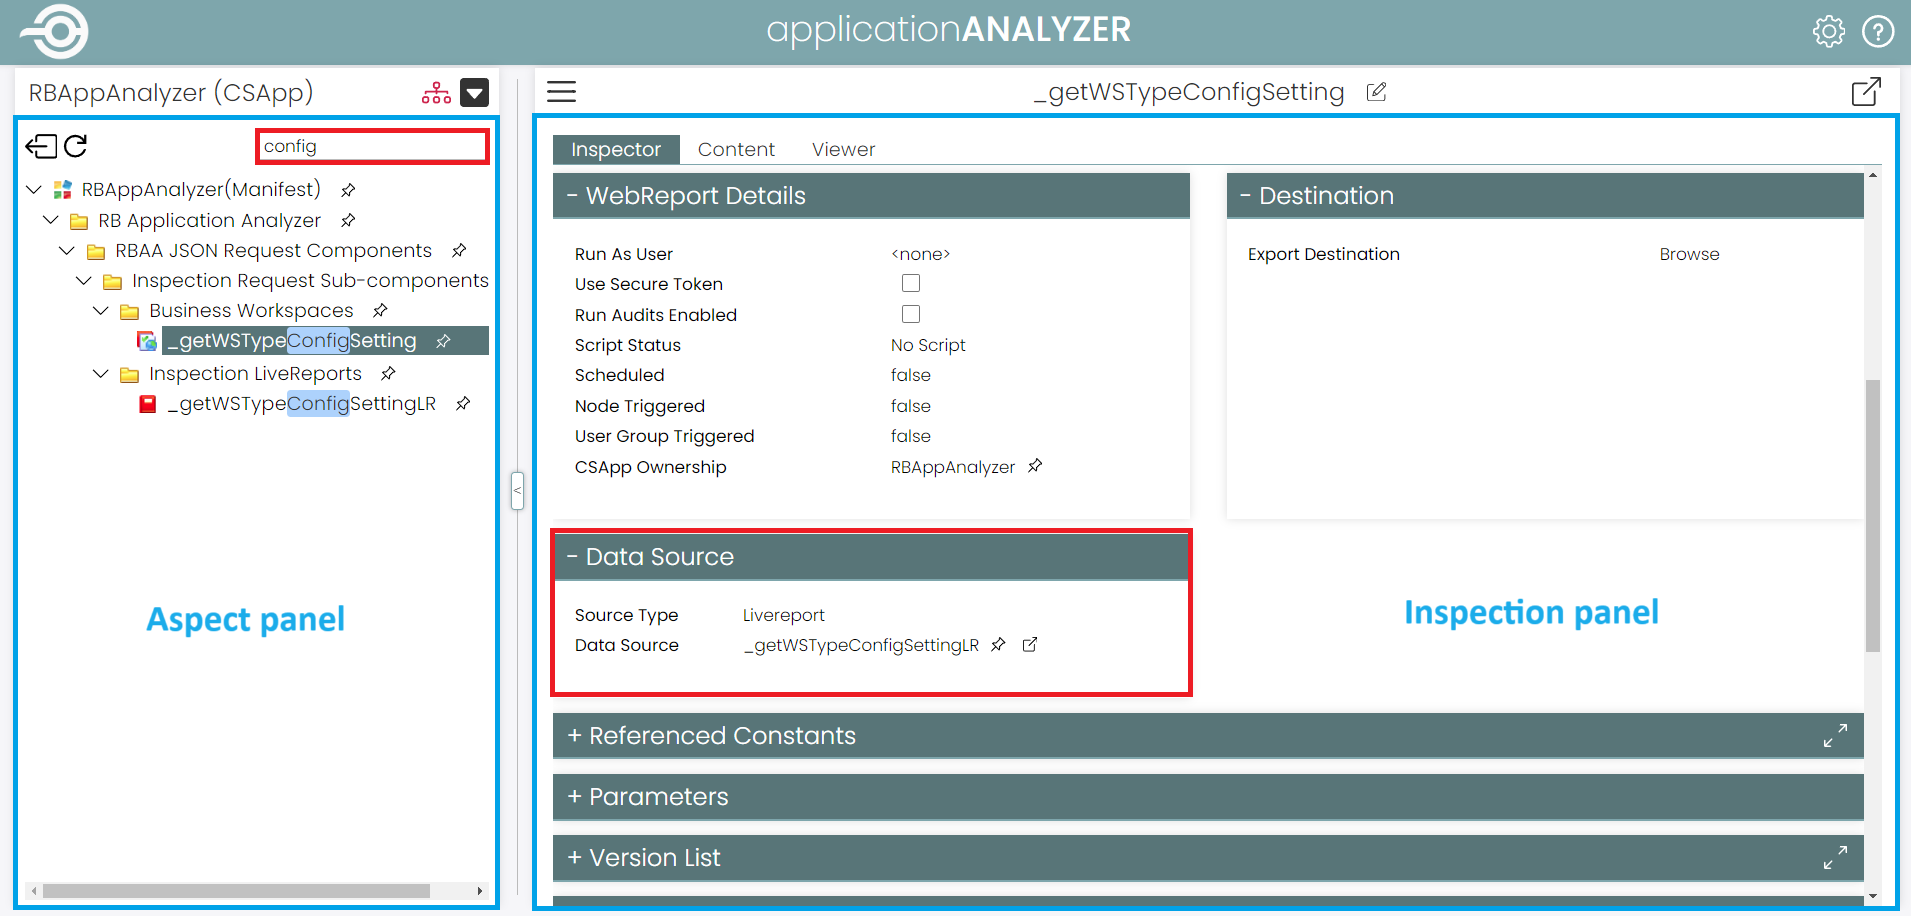
So, you can quickly locate objects relevant to what you are looking for by simply entering a key word that would be related to the area of functionality, eg. “user” or “trigger” or “workflow.” It’s not fool-proof (especially the WebReports that had been given obscure or unrelated names in the first place), but in most cases will find what you are looking for, or at least get you started in the right places.
Find Dependent WebReports
Having located the WebReport (and source LiveReport) that queries the database for the configuration settings, I now need to find out where and how often it has been referenced.
Application Analyzer has a Find Dependent WebReports menu option, which will do just that:
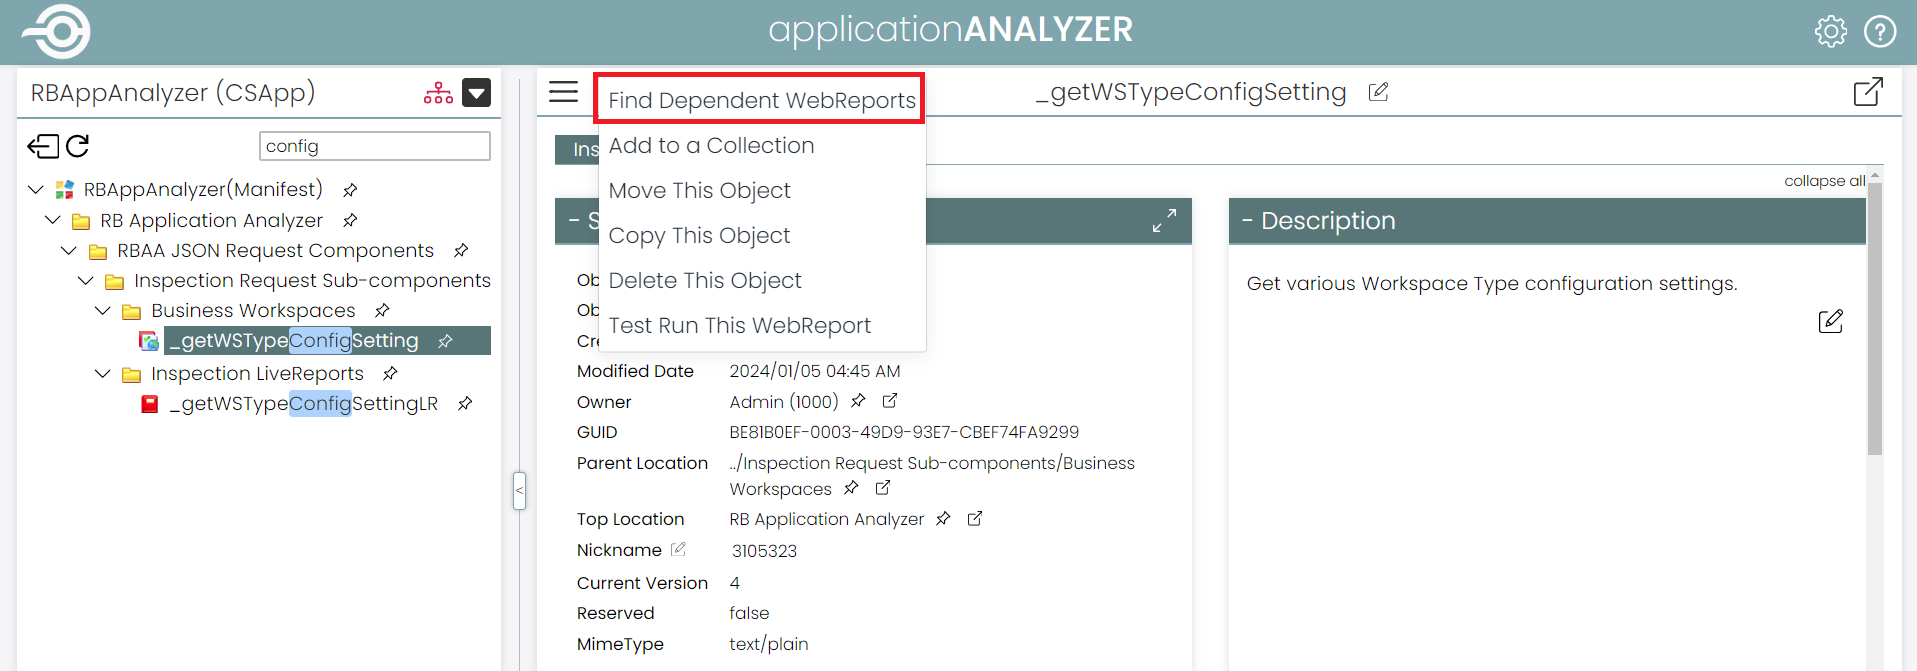
Here I can see that my configuration-reading WebReport is called by just one parent WebReport, and how it is referenced (as a Constant by the calling WebReport, and the Constant name):

Clicking on the thumbtack icon (![]() ) against the calling WebReport will load it in the Aspect panel:
) against the calling WebReport will load it in the Aspect panel:
Inspect for Content
Note that the Aspect panel now shows the calling WebReport, and any Sub-WebReports that are referenced by it.
Clicking on the Content tab of the calling WebReport will display the Reportview source, ready for review or editing:
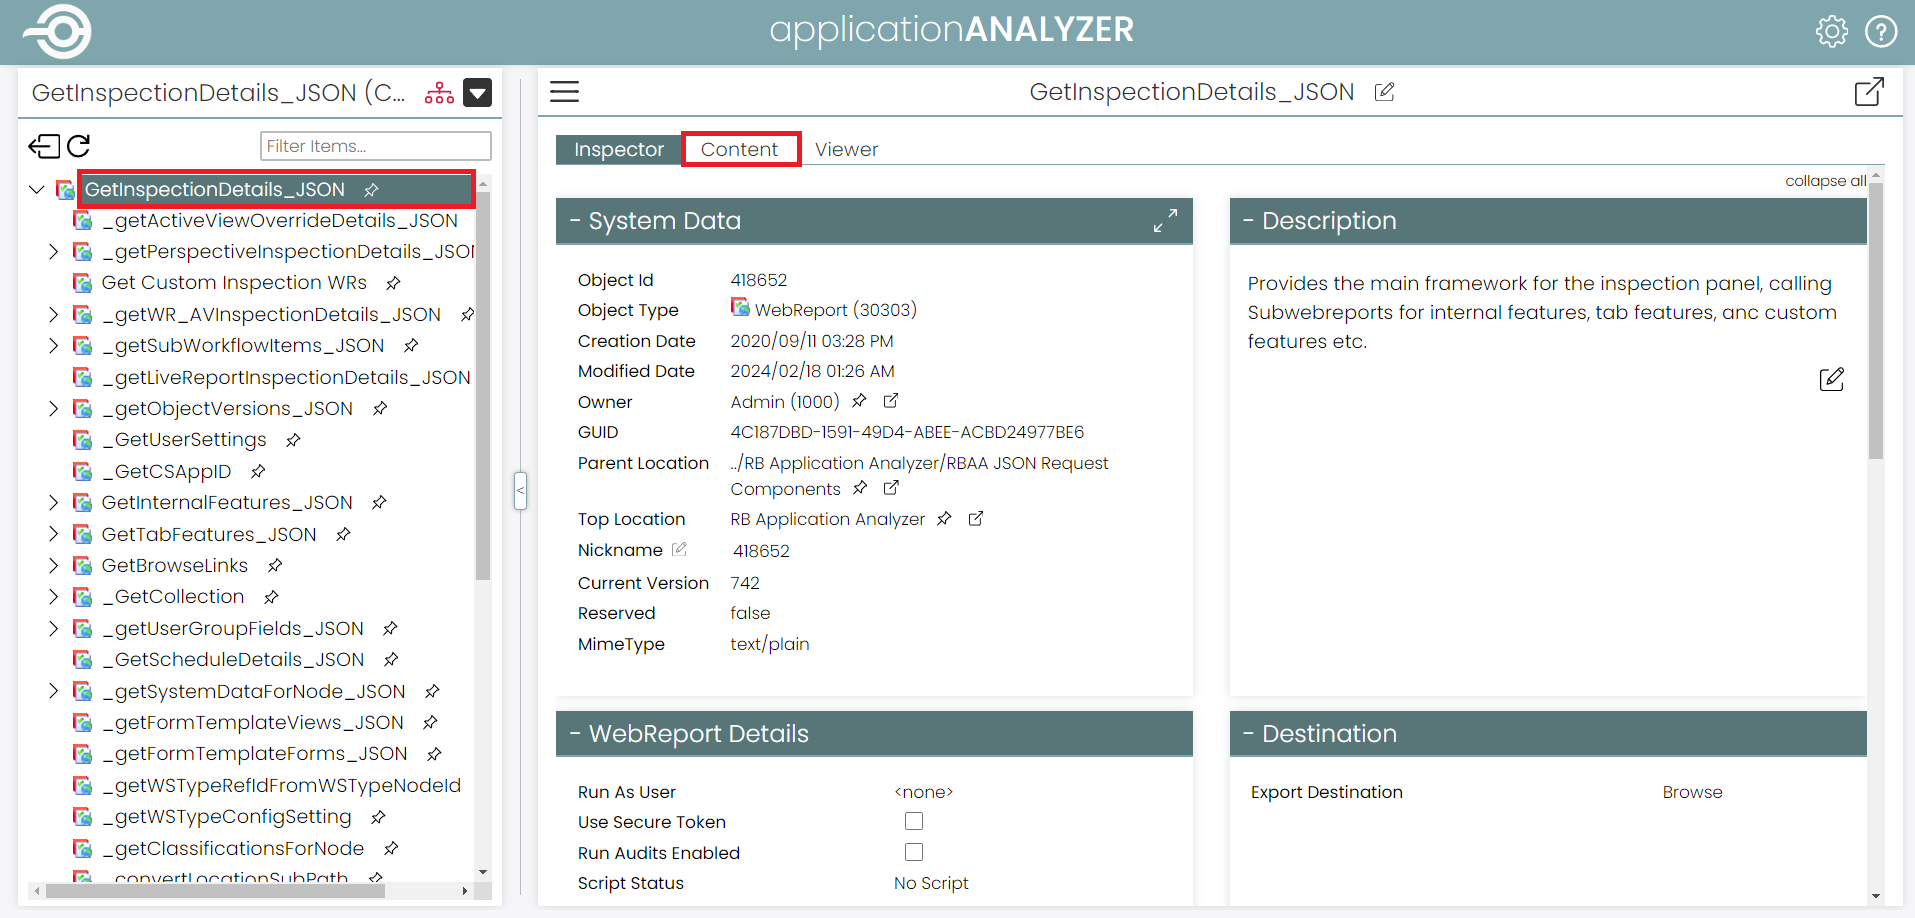
Once in the Content tab, I can do a standard “find” (Ctrl-F) in the Reportview code to search for the name of the Constant (displayed in Find Dependent WebReports, above) to see how many times the configuration WebReport has been called, which in this case is four times.
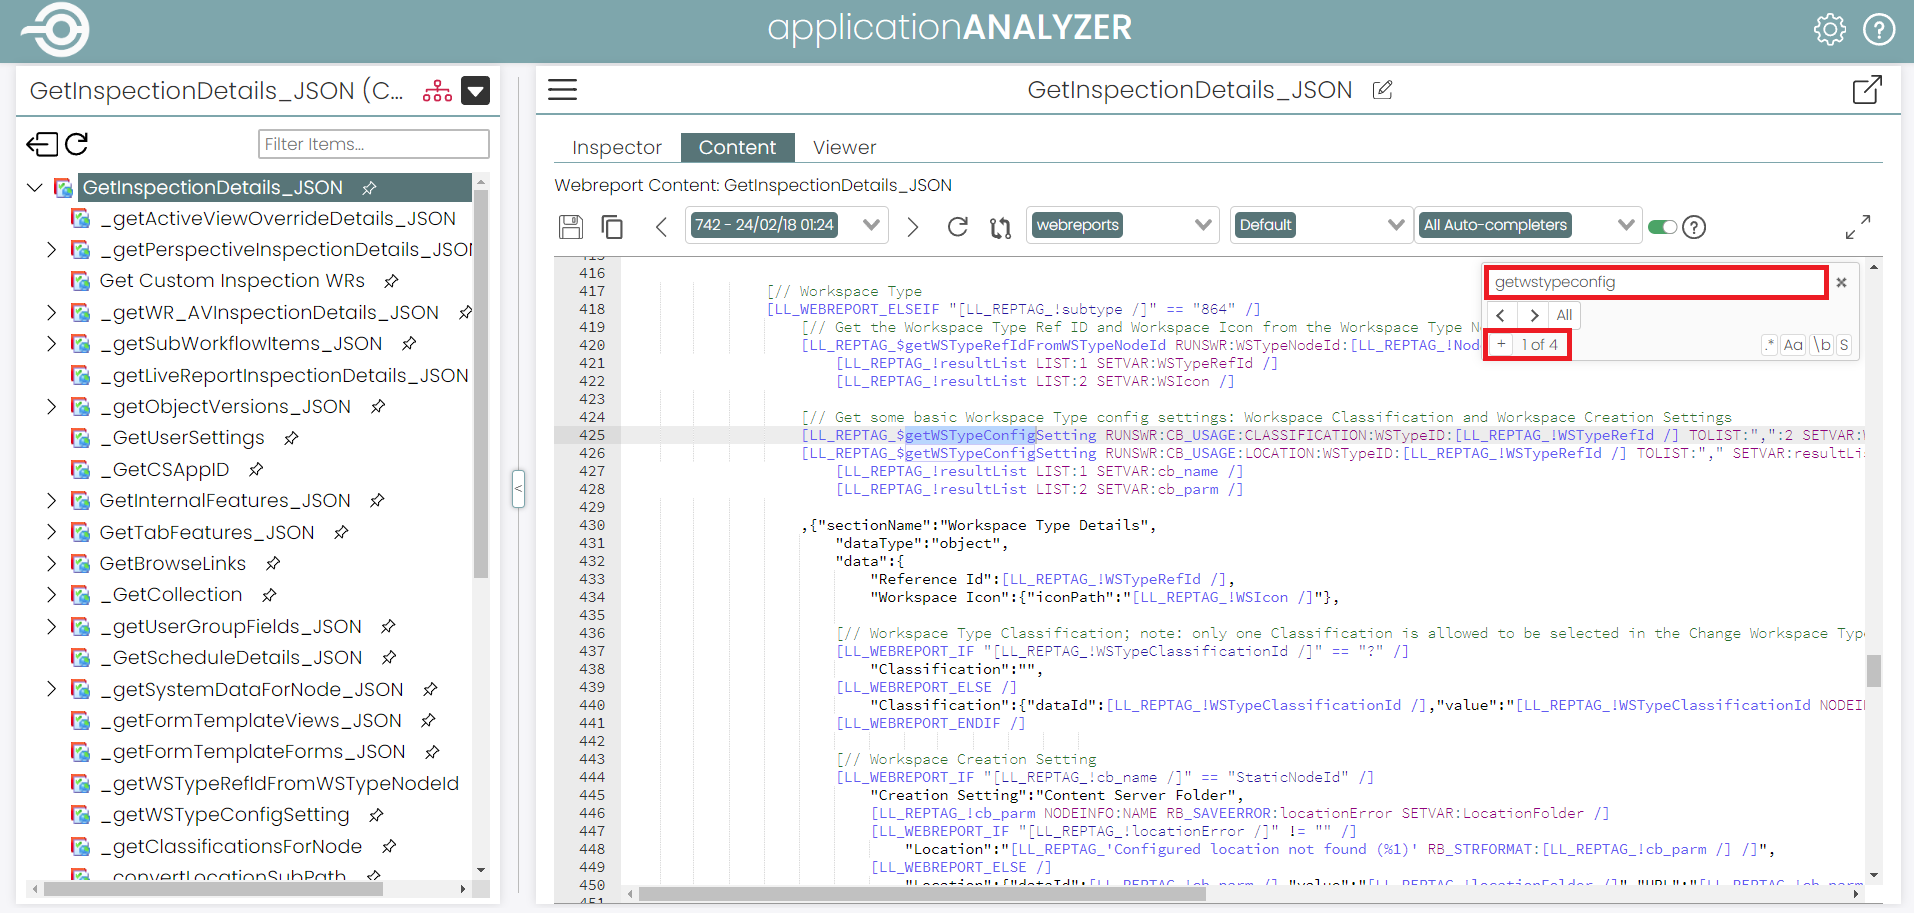
As it happens, the way the configuration settings are stored in the database is one row per setting, so each time it is being called to retrieve a different setting.
I had been looking to optimize this by replacing using a custom Sub-tag (to be developed), where one call could retrieve all the settings, and then process as necessary using local variables.
Using the Application Analyzer, I have quickly and easily identified the relevant WebReports that would require modification, should I develop the custom Sub-tag, and how many times the existing configuration WebReport was called, and from where.
Search WebReport objects by Text
Another way of achieving the same thing (identifying WebReports relevant to an area you are working on), is if you recall a certain field or parameter (or even a comment string), you can perform a Search WebReport objects by Text from the Aspect menu:
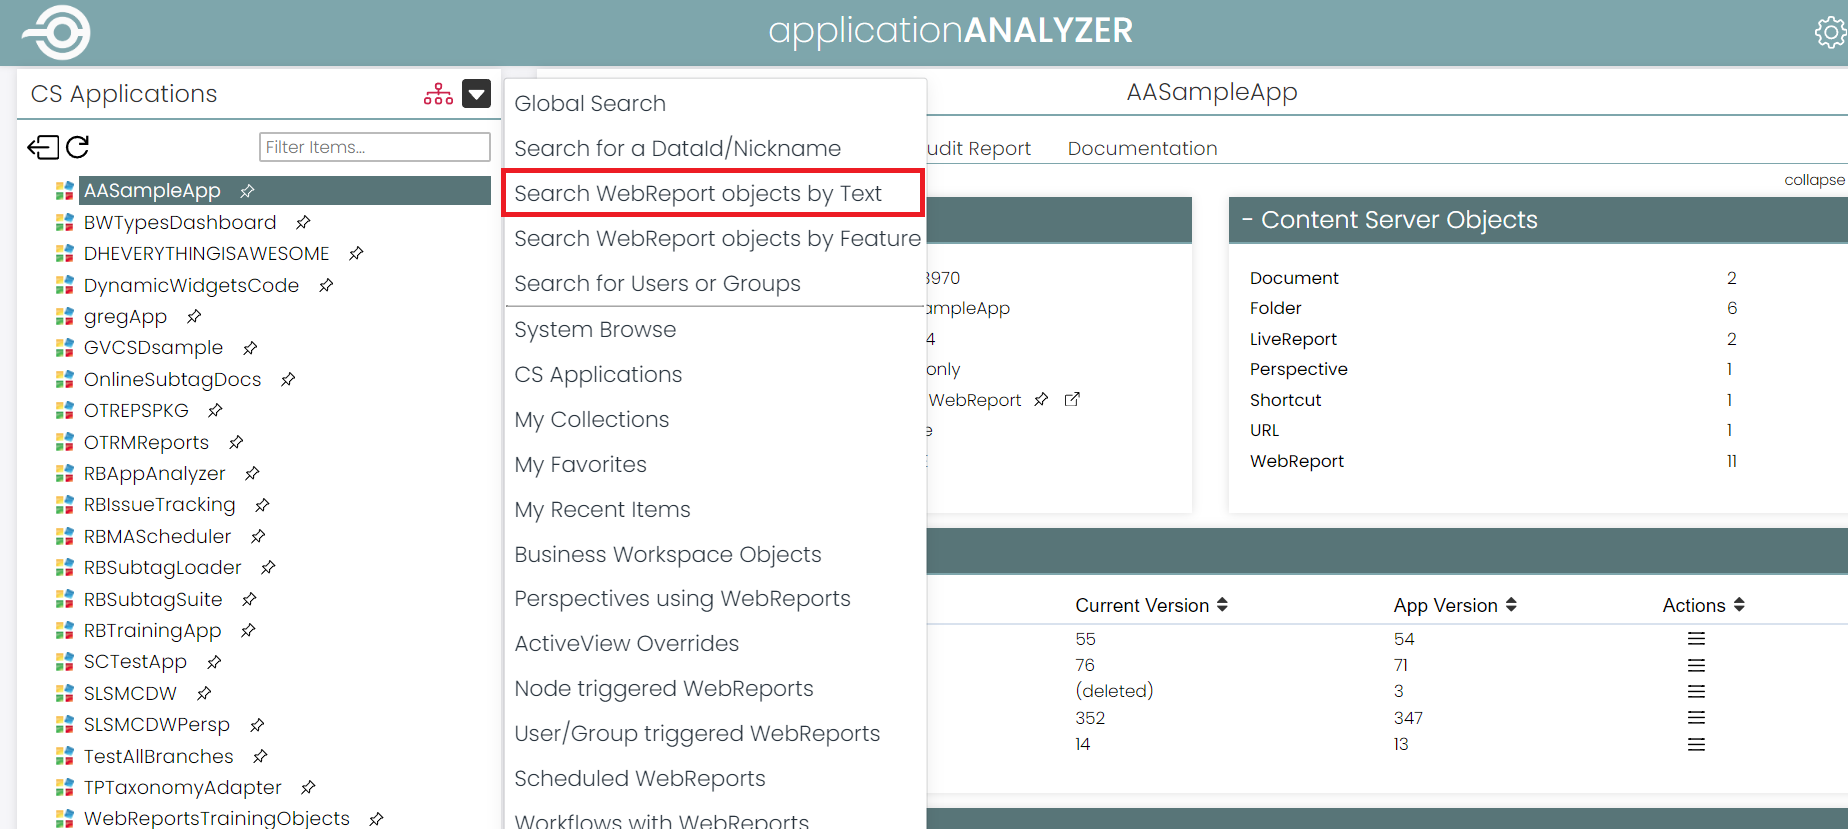
Having selected the menu option, a dialog box will appear asking for the Search Term (case insensitive) and CSApp Membership (either blank for across the entire Enterprise Workspace, or within a specific CS Application):
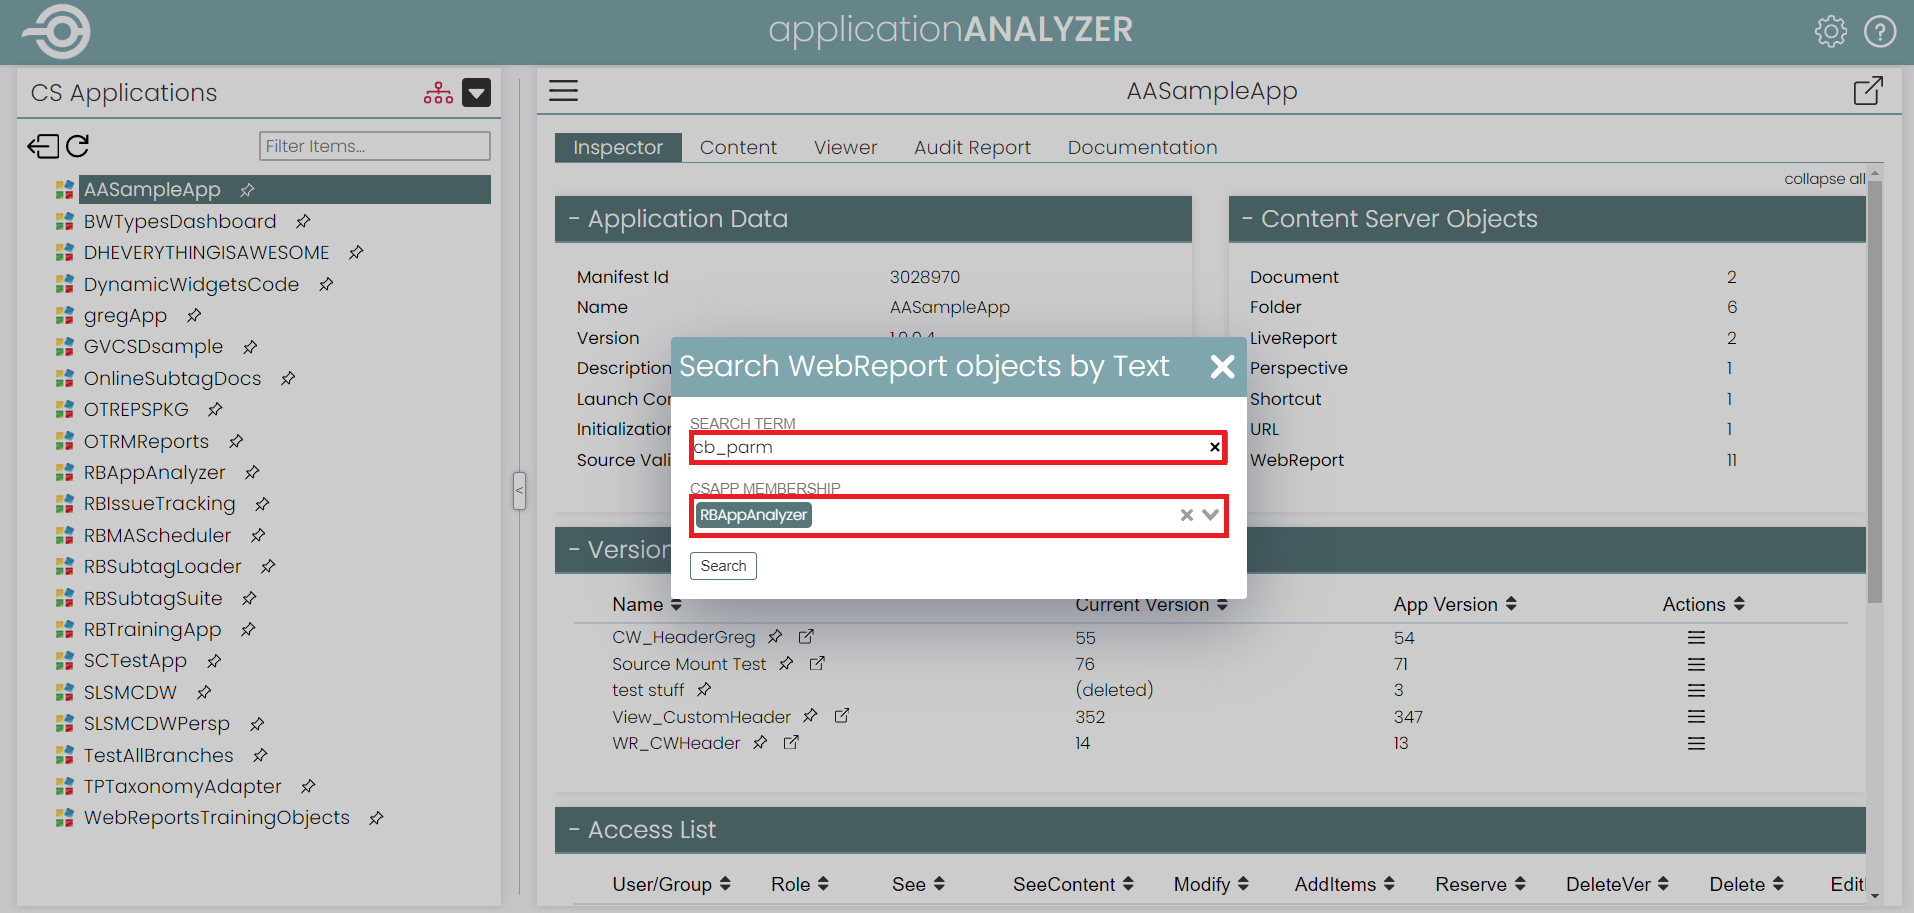
Here a search for “cb_parm” within the CS App has identified both the configuration WebReport and the calling WebReport that was identified above.

So, you can arrive at same destination by two different routes: either by knowing something in the name, or something in the content—the ultimate flexibility!
Development summary
The few features mentioned above don’t do the Application Analyzer justice (I haven’t even started to get onto the advanced Editing features; see Further Information to reference data sheets), but hopefully give a flavour as to what it can do for you to enhance productivity and take away some of the limitations or “pain points” of using standard WebReports to develop CS Apps.
With the help of Application Analyzer, you can really slay those applications!
"And hast thou slain the Jabberwock?
Come to my arms, my beamish boy!
O frabjous day! Callooh! Callay!"
He chortled in his joy.
Conclusion
So, hopefully I’ve given you a taste of what Application Analyzer can do to help you quickly get up to speed with an unfamiliar CS App, and to enhance your development of applications.
There’s a ton of features and functionality that I’ve only just lightly touched on here, based on my limited exposure to date of the Application Analyzer, some of which I wish I had available when working as professional services on client sites!
And that’s the point: you don’t need to know or use all of it to make a difference to your understanding of an application or productivity; just start with what you need first, and the rest will grow on you!
By way of example, I was looking to develop a report to help display and understand the configuration of Business Workspaces on a new site (you guessed it, I had to identify what had been configured, what had been abandoned, what was in use). I was persuaded to try to develop this using the Application Analyzer, plugging into its existing framework and interface. Did I mention you can extend and enhance the Application Analyzer for your own specific needs?
With minimal assistance but a little guidance, I was able to implement the solution without too much effort. You can see the fruits of my labour (and read about my take on the intricacies of Business Workspace configuration) here: Down the Rabbit Hole with Business Workspaces
Jabberwock tamed. Happy days!
Further information
What’s been your experience when it comes to maintaining and developing CS Apps? Tell us over on LinkedIn or send the team an email at info@ravenblackts.com.
Piqued your interest in Application Analyzer? For more information you can email Ravenblack or visit the site to request a demo or find additional information about Application Analyzer.
Data sheets for all Ravenblack’s products can be found at: webreportexperts.com
About the author
